Attopilot 50V 180A
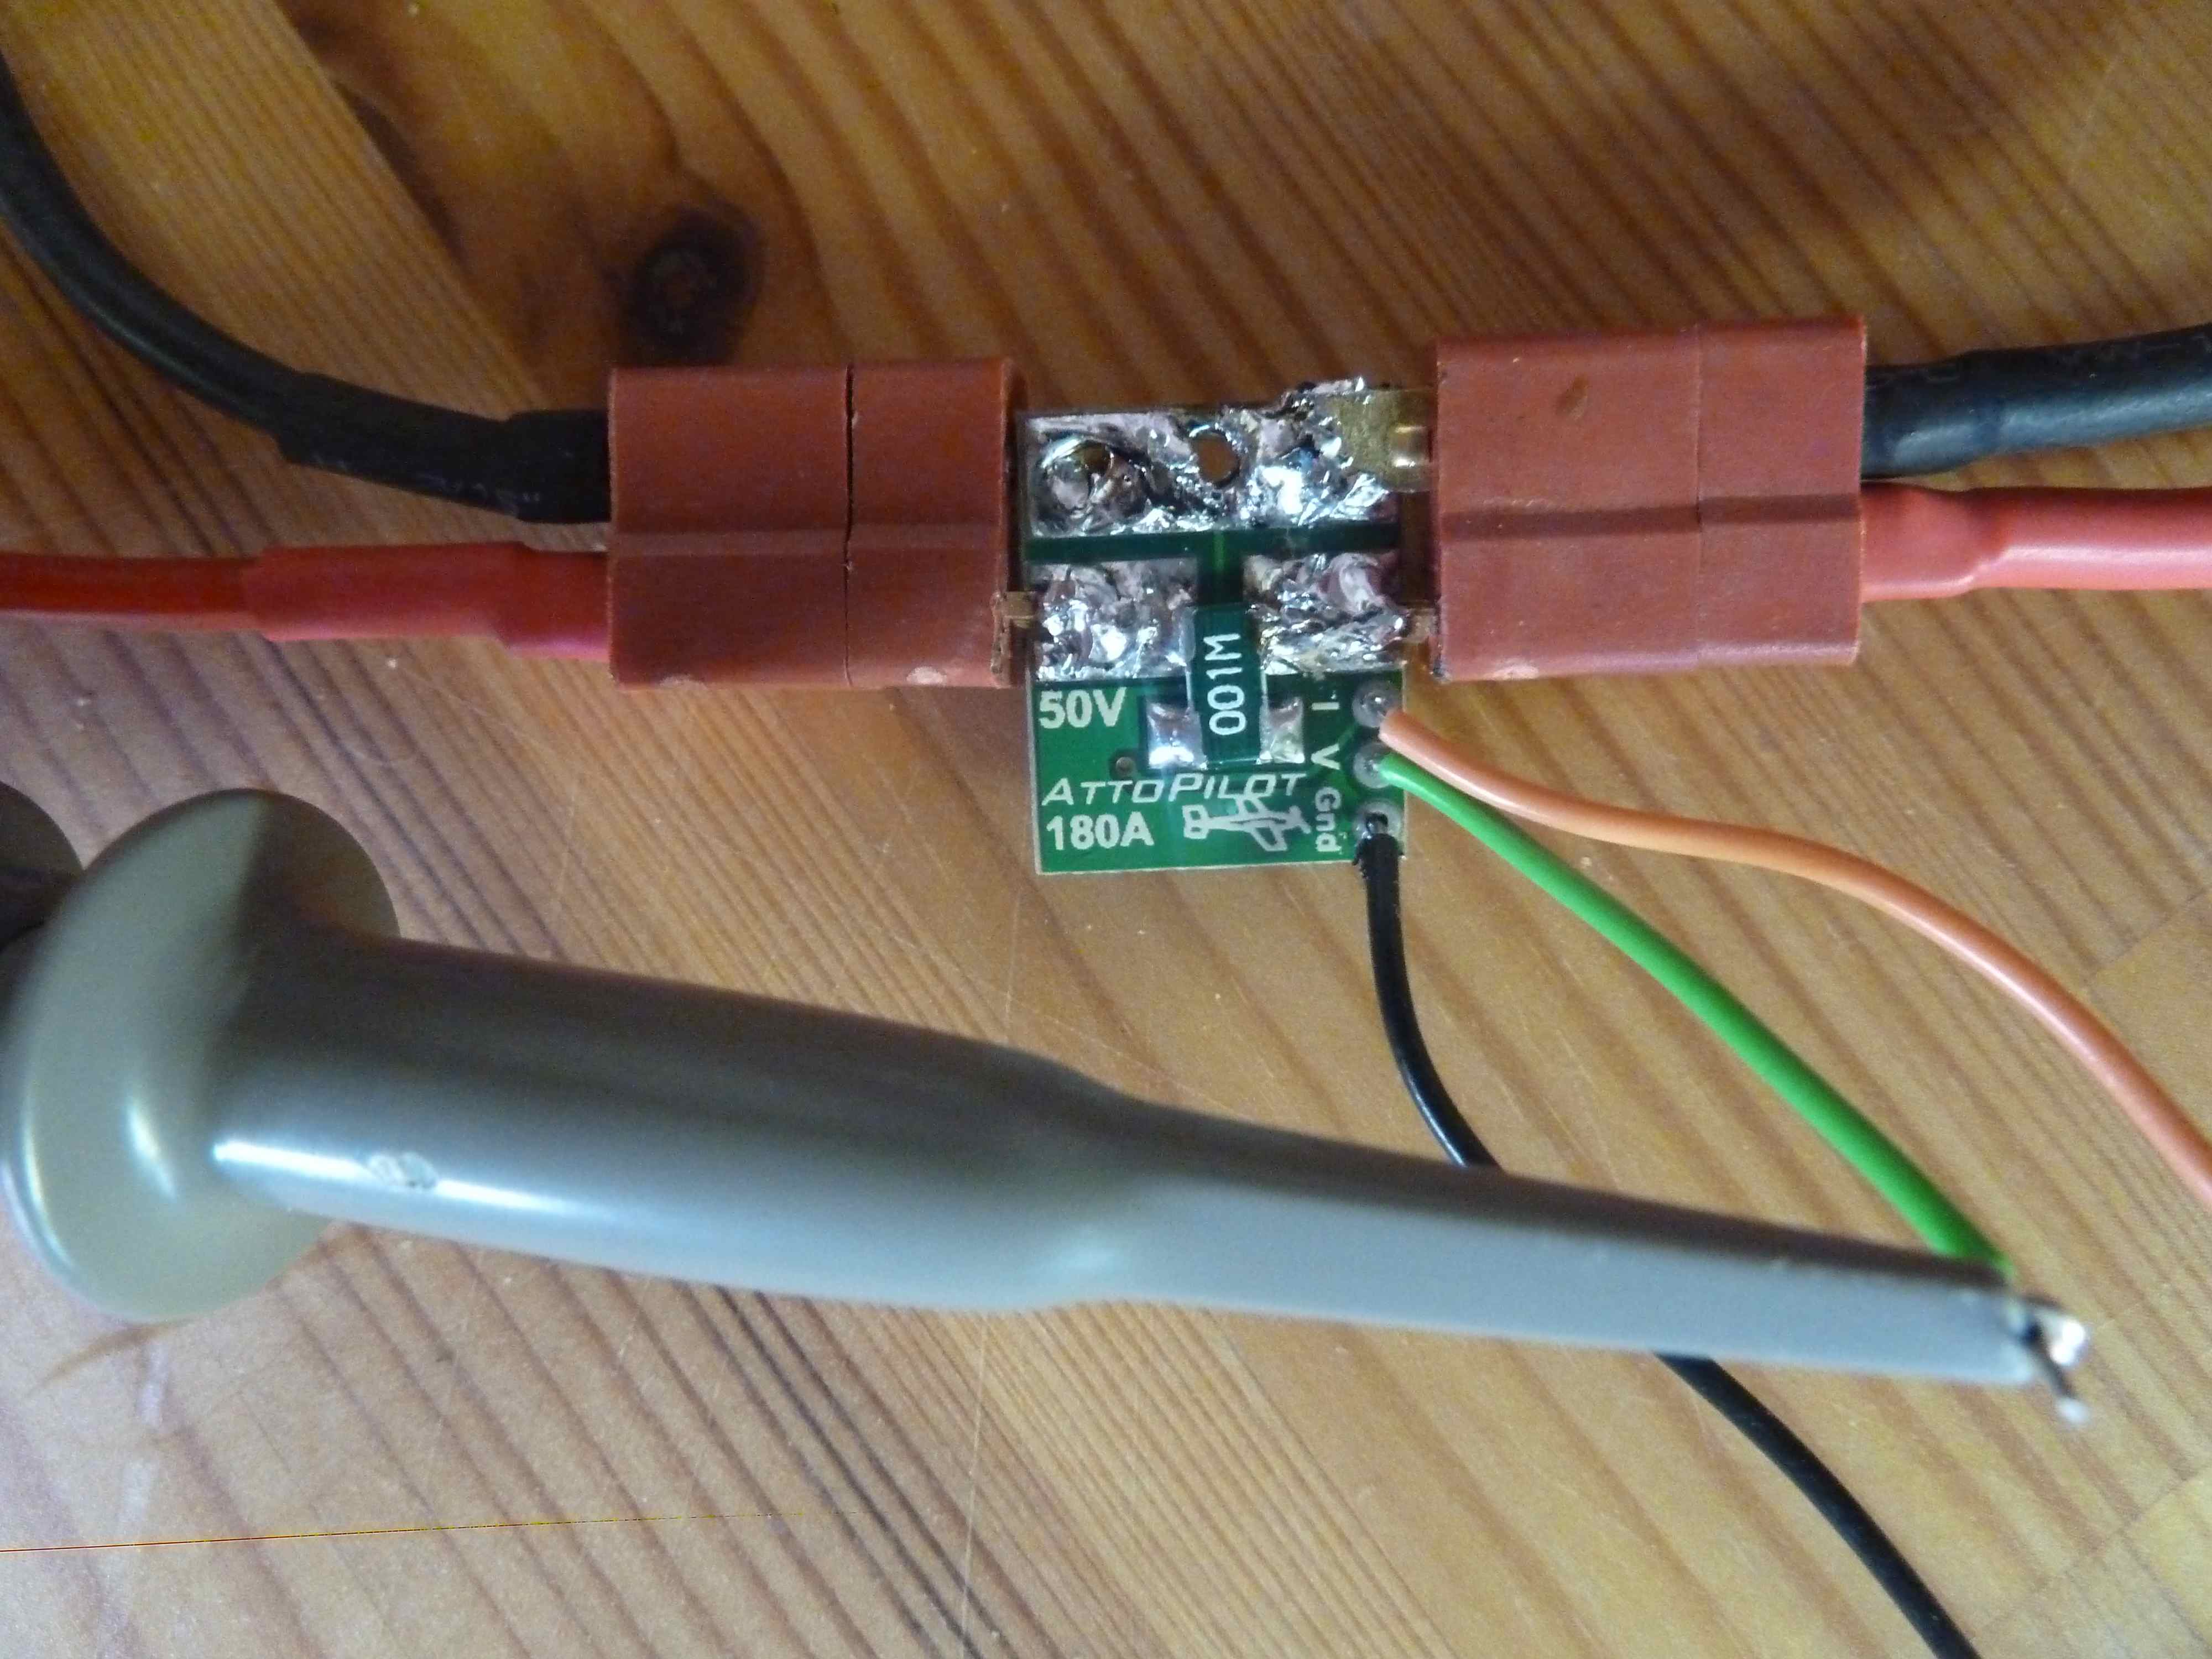
A few weeks ago we tested the Attopilot 50V 90A. Results were ok, we only noticed a small gap between measured and real amps. Today we show you the experimentation results of the 180A Attopilot sensor board. Again, we used the Deans connectors and quite a lot of solder to connect the Attopilot device to our load and PSU.
Dean Goedde, who designed this sensor board, has said the following in the product forum:
In a practical sense, this board was made for bursts of current over 100 Amps that might be experienced in a large electric powered UAV on takeoff acceleration, but otherwise would pull continuous amperage under 100, AND have constant flow of cooling air forced through the UAV body by the airstream to carry heat away from vicinity of this sensor and its leads.
So, don’t even think on pulling 180 Amps through this board continuously… It is only able to resist short high-amp bursts.
The analog voltage outputs of sensed voltage and sensed current are 63.69mV/V and 18.3mV/A respectively. We validated the device by comparing the displayed PSU voltages and amps with the device’s voltage outputs.
- PSU: 29.8A @ 24V
- V: +-1500mV => divided by 63.69mV/V => 23.55V
- I: +-450mV => divided by 18.30mV/Amp => 24.5A
- V: +-1500mV => divided by 63.69mV/V => 23.55V
- PSU: 19.6A @ 15.9V
- V: +-1000mV => 15.7V
- I: +- 320 mV => 17.4A
- PSU: 14.8A @ 12V
- V: +-750mV => 11.77V
- I: +-250mV => 13.66A
Similar to the 90A version, the measured current was a bit low (probably, software calibration can be used to solve this issue). There was quite some jitter on both voltage outputs but this was probably due to the power supply.
Next to this basic test, we verified our MCU and software stack by reading the (converted) adc samples via serial. Here’s the results:
- PSU: 7.3A @ 6V
- Scope (sensor board output): 210mV @ 420mV => 11.4A @ 6.6V
- Software output: 11.3A @ 5.8V
- PSU: 14.4A @ 11.9V
- Scope: 380mV @ 700mV => 20,8A @ 11V
- Software output: 20.4A @ 11.4V
- PSU: 20A @ 16.7V
- Scope: 450mV @ 1000mV => 24.6A @ 15.7V
- Software output: 27.6A @ 16V
There is good news and bad news. The good news is that the output of our software stack is in line with the voltage output of the sensor board (so our stack works – note that we used the internal adc ref for this test). The bad news is that (in this particular test) the measured-and-software-stack-interpreted current was too high?! In order to find the root cause (PSU output, PSU display or sensor board) we were changing the wiring when – suddenly and without prior notice – the sensor board made a crackling noise… game over 🙁 Our mistake.
For prototyping the charge controller, we are probably going to use our own sensor board for internal and external current sensing.

Speak Your Mind